Julia Olennikova Display Advertising Stats 2017: SEMrush Study 75 Wow-Score The Wow-Score shows how engaging a blog post is. It is calculated based on the correlation between users’ active reading time, their scrolling speed and the article’s length. Learn more Display Advertising Stats 2017: SEMrush Study
- 176
- 49
- 54
Whether you are tentatively planning your first display advertising campaign or can already create one in your sleep, you will still need data to come up with an effective action plan.
To help you in this challenge, SEMrush has pulled together information on over 2 billion impressions of 2000 major GDN advertisers, based on data from our Display Advertising report. As a result, we identified several interesting trends and patterns that will help advertising specialists make more data-driven decisions in their upcoming GDN campaigns.
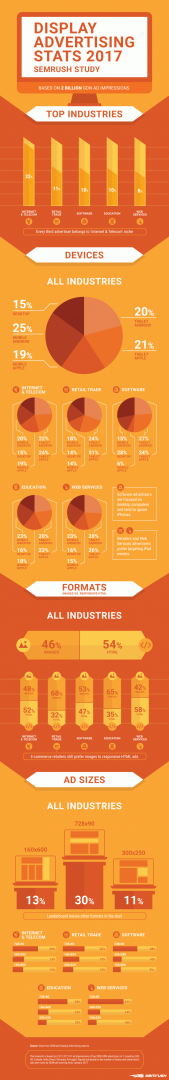
First of all, the industries that use GDN most often were determined; we divided the advertisers from our list by topic (each website could have up to five topics to belong to simultaneously) and made a list of five most frequently encountered industries.
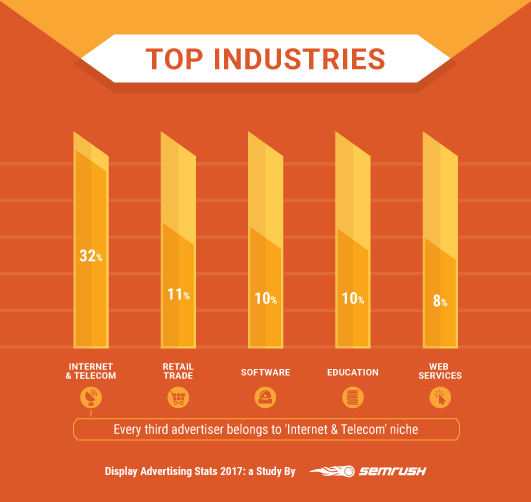
From our analysis, Internet & Telecom websites (social networks, search engines, advertising providers etc.) turned out to be the most active in terms of GDN usage (32%). They're followed by Retail Trade (11%), Software (10%), Education (10%), and Web Services (8%).
Let's see the key takeaways we gathered from the study:
Desktop Is The Underdog
5 years ago it was hard to imagine desktop as the least popular device type. However, in 2017 it turns out to be an underdog among the top advertisers: generally, only 15% of ads noticed by SEMrush were shown on desktop computers.
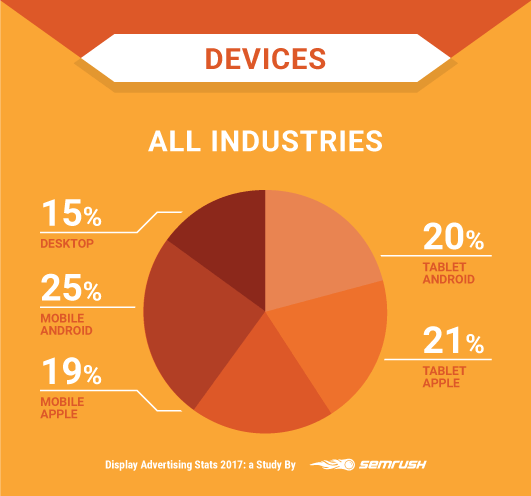
But if we look at each of the top industries separately, the situation changes. Advertisers from Software niche still target desktop in their campaigns more than any other device (28%) and almost ignore iPhone owners (6%). Meanwhile, the websites that belong to the Retail Trade niche are strongly focused on iPad users (31%). The advertisers from Education niche don’t have strong "preferences" – the impressions are distributed quite evenly across devices (from 16% to 23%).
You can see all the details in the full version of the infographic at the end of the post.
There's Still No Big Gap Between Images and HTML Ads
Despite responsive HTML ads being easier to handle with their "one size fits all" approach, they are not radically prevalent globally yet (54%) compared to standard “media” ads including static or animated images (46%).
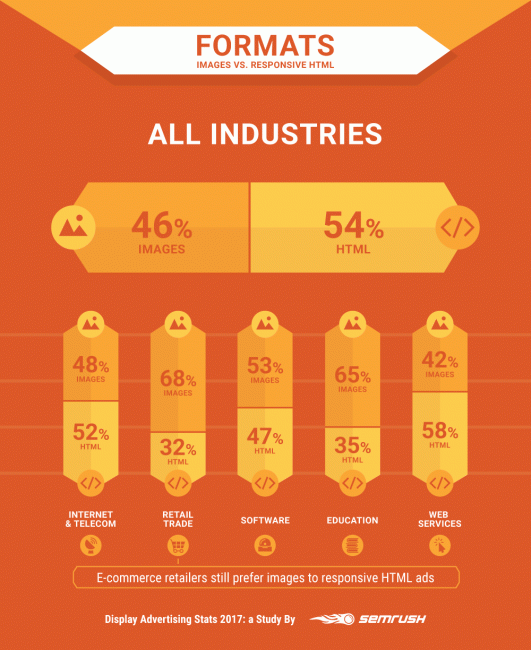
Looking at certain niches more closely, we can notice that only Retail Trade and Education industries are dominated by media ads (68% and 65%), while in other categories the distribution is almost equal.
Every Third Ad Is A Leaderboard
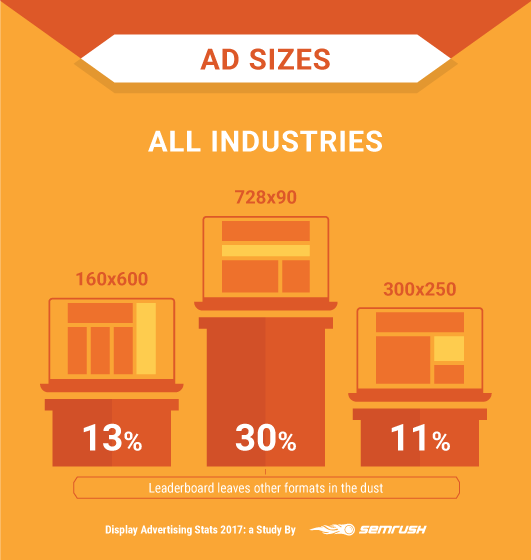
According to our analysis, the most frequently seen size in 2017 doesn’t correspond to the top performing ad sizes (300×250 and 336×280) identified by Google. 728×90 (leaderboard) was absolutely the most popular ad size in all countries and industries, leaving other formats far behind.
Now it's time to explore the entire infographic!
What Does It Mean To You As a Marketer?
It is always useful to be aware of global trends. However, when it comes to planning a single campaign, you need to dig deeper and see if the rules of the game are different in your niche. Before bidding on a certain tactic, smart marketers should perform thorough research and analyze what their competitors and market leaders do.
If you are ready to risk and test, you can take an adventurous approach – for example, targeting desktop users more actively (according to a Stone Temple study, desktop users spend more time on site, and this is one more reason you shouldn't ignore them). Or, if you feel like following the trodden path, you can adapt your competitors’ tactics and see if they work for you.
What If I Couldn't Find My Niche In The Infographic?
In this study we concentrated on the 5 most popular industries, however, we realize there are many more market niches that deserve attention. So if you’d like to get data on other industries, let us know in the comments!
Meanwhile, we invite you to try the SEMrush’s Display Advertising tool that will help you take advantage of your rivals' best practices. Read our guide "How to Uncover Your Competitors' Ad Strategies" to make the most out of the report!
Uncover Your Rivals’ Ad Strategies
With Display Advertising tool
Please specify a valid domain, e.g., www.example.com Try now! PPC  Julia Olennikova Senior Content Writer at SEMrush with a weak spot for PPC. Migrated from journalism to digital marketing and je ne regrette rien.Read the original article here