Matt Osborn How Marketers Lie to themselves, With Numbers 92 Wow-Score The Wow-Score shows how engaging a blog post is. It is calculated based on the correlation between users’ active reading time, their scrolling speed and the article’s length. Learn more How Marketers Lie to themselves, With Numbers
- 96
- 21
- 37
- 1
Every marketer is driven to meet Key Performance Indicators (KPIs) whether they are open rates, unique visits, leads, or opportunities; we are a competitive group that is continually pushing the bar. Sadly this competitive nature is also responsible for sales and marketing to make quick assumptions about their individual performance without questioning the metric’s validity.
We have all heard the saying "The numbers never lie." That is not to say that they can not be easily manipulated. I have recently gone to a couple of advertising agency websites and seen amazing statistics such as, "we have increased website traffic by 50% in just three months!". As fantastic as that sounds, you have to wonder, "What was the traffic before?" If their traffic was 10 thousand visits a month, the agency is pretty amazing. Although if the traffic was only 20 visits a month and it took them three months to get 10 additional views a month, then they are quite horrific.
I know what many of you are thinking. That example is a very extreme scenario of manipulating numbers, but sadly the vast majority of marketing and sales do the same thing in their reporting. We look for the numbers that show we are an asset to the company. If your website traffic beats last month's, we get excited and call it a vast improvement.
When we send out an email to 100 prospects and five more people open over the last send, you don't tell your boss, "5 more people opened my email", you tell the boss, "I increased the open rate by 5%!"
We have all subconsciously manipulated numbers to show improvement. Sadly, these false statistics get in the way of finding out the real truth about how our efforts are the cause of performance goals. For that reason, I will walk through the best ways to critique and validate your numbers.
Was it blind luck or actual change?
If your business sends an email out at the same time every week, it is unlikely that you will see the exact same open rate or click rate. The email's topic, seasonality, or just plain random luck all play a role in these metrics. So how do we know what is an improvement, and what is just blind luck?
To show validity to any change in performance, a marketer needs to measure the variation expected in their control. A control would be any set of metrics that have not been exposed to your recent change; this could be something like previous conversion rates or open rates. By calculating how much the metrics vary on average with no change, we can assume anything that exceeds these variances is because of your manipulation or campaign.
Calculating the standard deviation is quite easy by using the standard deviation function in Excel or Google Sheets (=STDEV). If you are curious about the calculation or have a lot of free time, you can calculate it manually through the steps below:
The Control Group: 345, 349, 350, 337, 329, 333, 335, 327, 351, 344.
Finding the mean (total sum / # of numbers used): (345, 349, 350, 337, 329, 333, 335, 327, 351, 344) / 10 = 340.
Subtract each the mean from each number, then square the difference:
(345-340)^2 = 25
(349-340)^2 = 81
(350-340^2 = 100
(337-340)^2 = 9
(329-340^2 =121
(333-340)^2 = 49
(335-340)^2 = 25
(327-340)^2 = 169
(351-340)^2 = 121
(344-340)^2 = 16
Find the mean of the squared numbers: (25,81,100,9,121,49,25,169,121,16) / 10 = 71.6.
Square root the mean to find the deviation of 8.461678321.
Now that you know the standard deviation, you can apply this back to the mean, or average. If any metric is more than one deviation away from the control's mean, we can assume that the change made a valid difference (with 70% confidence). A breakdown of the confidence percentages below:
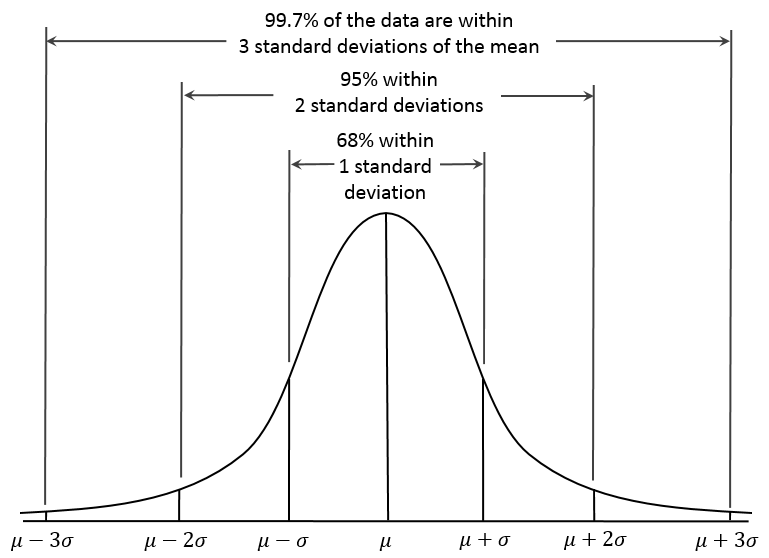 Standard Deviations – Normal Distribution
In this situation, our mean was 340 with a deviation of 8.46. Therefore, anything lower or higher than one standard of 340 is most likely a change you created. In this case that would need to be higher than 348.46 or lower than 331.54.
Was it correlation or causation?
This is where the impatient marketers get frustrated. Just because your performance is one or more deviation away from the mean does not say that you are responsible for it! There are always infinite variables that can play a part in any difference, how is your modification 100% responsible?
Just like margarine consumption is probably not the reason for divorce in Maine, there is a good chance that changing the color of a CTA (Calls-To-Action) wasn’t responsible for dramatic growth.
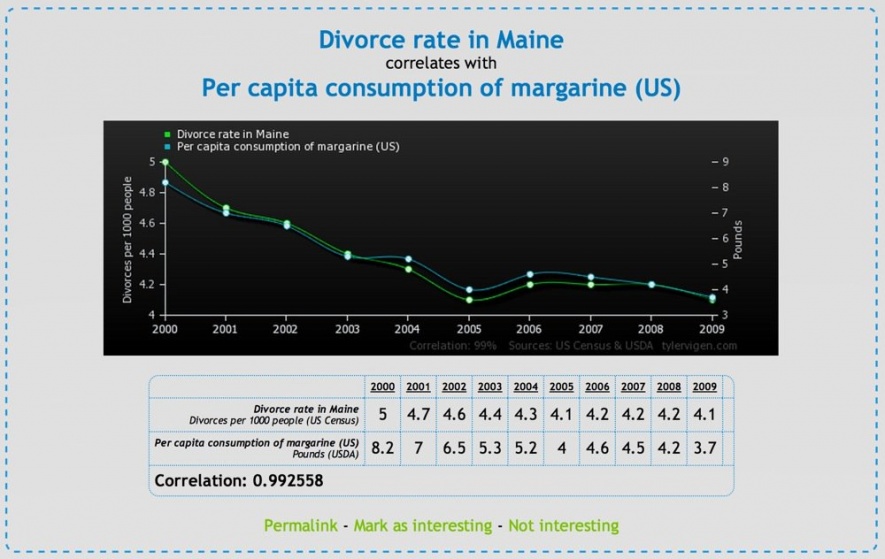 Correlation does not mean causation – Divorce Rate and Margarine
Contributing growth to something that is not viable will undoubtedly lead you down a path where you apply changes across the board and gain no benefits. To make data valid, it needs to be tested as the cause more than once. Some tests you may want to try:
-
Does removing the change make the metrics go back to normal?
-
Does the change continue to perform the same results in future tests?
-
Can you A/B test and compare the two results at the same time?
Did you gather enough information?
I believe we have all had moments in our career where we make something new, and leads or sales come in immediately after its creation. In our very hopeful heads, we say "I have just increased X in a matter of minutes!". Sadly these moments of instant gratification rarely lack merit.
To drive valid numbers from your target market, we need to use a threshold of confidence across the population. This is important to make sure a single variable does not have the ability to drastically change the metrics. For example, your business sends out an email to 10 leads, and the open rate is down 10%. This would be a catastrophic failure if it were a big email, but in this case, it could just be a single person that is out of office and did not open it. To make sure we do not let this happen, we need to choose an appropriate sample size.
Below is a standard breakdown of sample sizes that apply to the general population:
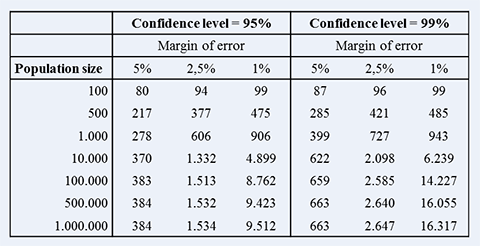 Estimating population size for marketing.
If we are talking about website conversions, I would use a population of 10,000 or more and aim for a 1% margin of error leaving me to wait for 4899 views before I conclude my findings. In a situation such as an email where you may have a small user base, using a lower population size and confidence level may be acceptable.
In Conclusion
Sales and marketing's competitive nature is driven by the need to surpass KPIs. Although this characteristic undoubtedly helps innovation in the field, it is also responsible for the impatient and hopeful behavior that commonly leads to using unreliable data which hurts long-term performance.
To truly drive long-term growth, marketers need to differentiate what is fact, and what is merely blind luck.
Marketing  Matt Osborn Matt Osborn is the Senior Marketing Manager at Apruve, a Fintech company that is revolutionizing how businesses buy from each other. He is a gifted “dad joker” although he has not fathered any children and currently has the second highest score in NES Donkey Kong in company history.Read the original article here