Jana Garanko The Top 10 Traveling Trends in 2017 45 Wow-Score The Wow-Score shows how engaging a blog post is. It is calculated based on the correlation between users’ active reading time, their scrolling speed and the article’s length. Learn more The Top 10 Traveling Trends in 2017
- 69
- 10
- 8
As we all know, long gone are the times when people relied on traditional brick-and-mortar travel agencies to plan their road trip or high-flying getaway. Now there are plenty of opportunities to organize a dream journey online, be it backpacking with nights spent at hostels or flying first-class to relax at elite hotels.
With travel season in full swing, SEMrush decided to collect and analyze search engine query and web traffic data to figure out what destinations travelers are looking for and which websites are attracting the greatest number of users.
We further crunched the data to show the relative significance of organic, paid, referral, and social media in driving traffic to travel websites and to highlight the difference between U.S. and global search requests for travel destinations.
Finally, we analyzed the use of display ads, and how travel websites are advertising U.S. and worldwide destinations. Below we break down what we found.
Disclaimer: SEMrush is in no way related to any of the websites mentioned in the article, as our marketing toolkit allows an unbiased analysis of the online data.
Key Takeaways
- Tripadvisor.com is the most visited traveling website in the United States, with Airbnb.com ranking second and Expedia.com third.
- In the most queried destinations, by travelers, this study found New York as the most favored destination in the U.S., nudging out California for hotel stays and a close second to Hawaii for flight reservations. Florida is also heavily favored as the third most popular for both hotel and flight bookings.
- Mexico is heavily favored as a worldwide destination advertised by travel sites, especially its trendy tourist city of Cancun. For U.S. destinations, Las Vegas and Florida are promoted throughout the year.
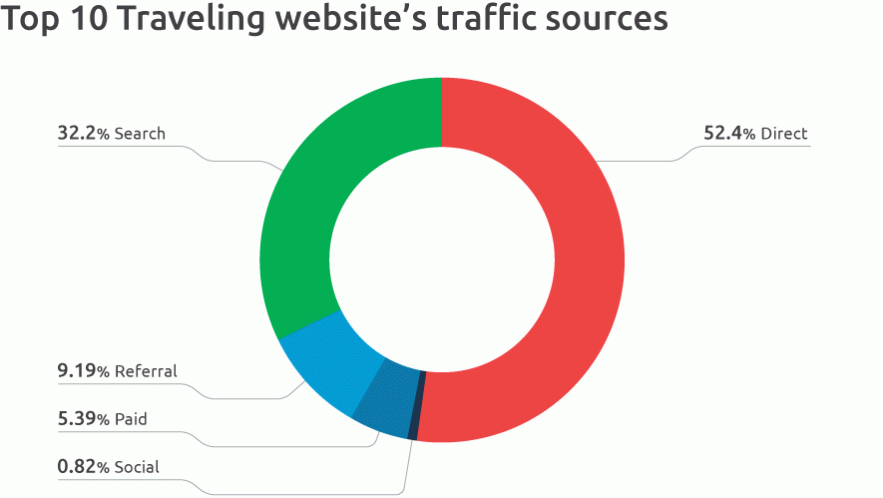
- Direct traffic accounts for 52.4% of travel site traffic, followed by search (32.2%), referral (9.19%), paid (5.39%) and finally social, at 0.82%.
- Facebook overwhelmingly dominates in social media channels, driving 82.03% of traffic. The closest second is YouTube, accounting for 6.22% of traffic.
- Leaderboard ads (728 x 90) are favored by travel sites, accounting for 25.3% of all display ads.
Most Visited Websites In the U.S.
So of the top 10 U.S. travel websites, which is first in traffic? TripAdvisor.com leads the list of the top 10, with Airbnb.com ranking second and Expedia.com third.
Our analysis broke down the top 10 websites’ traffic, as follows:
 Note: Booking.com and Priceline.com are both subsidiaries of The Priceline Group.
Airbnb is the only homes rental website that made the top 10. It boasts an impressive 17.8% of the total traffic of the top 10 sites, second only to TripAdvisor. Apparently, the service doesn’t have any serious contenders in its vertical (yet).
Most of the top 10 sites pursue a diversified approach by offering multiple services, such as reservations for flights, car rentals, hotels and/or restaurants.
Four of the top sites are claimed by single-solution (meta search) sites that allow users to search for all of their travel-related needs at once. Of these, Expedia ranks the highest, coming in third with 11.6% of the top 10’s total web traffic.
Of the top 10 sites taken by the major hotel networks Marriott and Hilton, Marriott narrowly claims the larger number of web traffic with 6.7% to Hilton’s 6.5 percent.
Sources of Web Traffic for the Top U.S. Travel Websites:
All told, over half of travelers know exactly what site and services they want. Direct traffic accounts for 52.4% of travel site traffic, followed by search (32.2%), referral (9.19%), paid (5.39%) and finally social, at 0.82%.
As we noted in our recent study of how leading e-commerce companies drive traffic to their websites, the relative dominance of direct traffic in the travel industry space can be attributed to long-term brand familiarity, repeat business (brand loyalty) and good brand awareness.
Next, we will go over what we discovered about search, referral, paid, and social media traffic.
Search Traffic: Traveler Queries & Destination Preferences
Accounting for 32.2% of travel site web traffic, search is the second largest source. Our analysis crunched the data to reveal the U.S. and worldwide destinations most queried by travelers, as determined by the volume of search requests for hotels (with keyword hotel + name of the country/city) and flights (with keyword flight + name of the country/city).
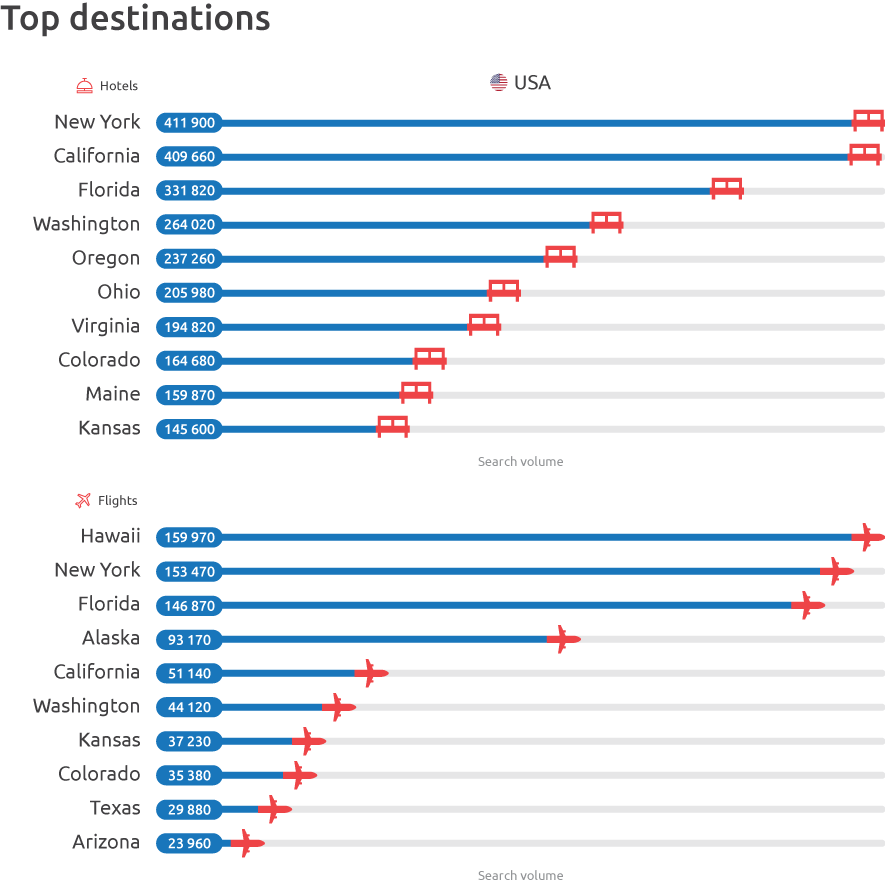
New York is the more favored destination in the U.S., nudging out California for hotel stays and a close second to Hawaii for flight reservations. Florida is also heavily favored as the third most popular for both hotel and flight bookings.
Here is what we found for worldwide destinations:
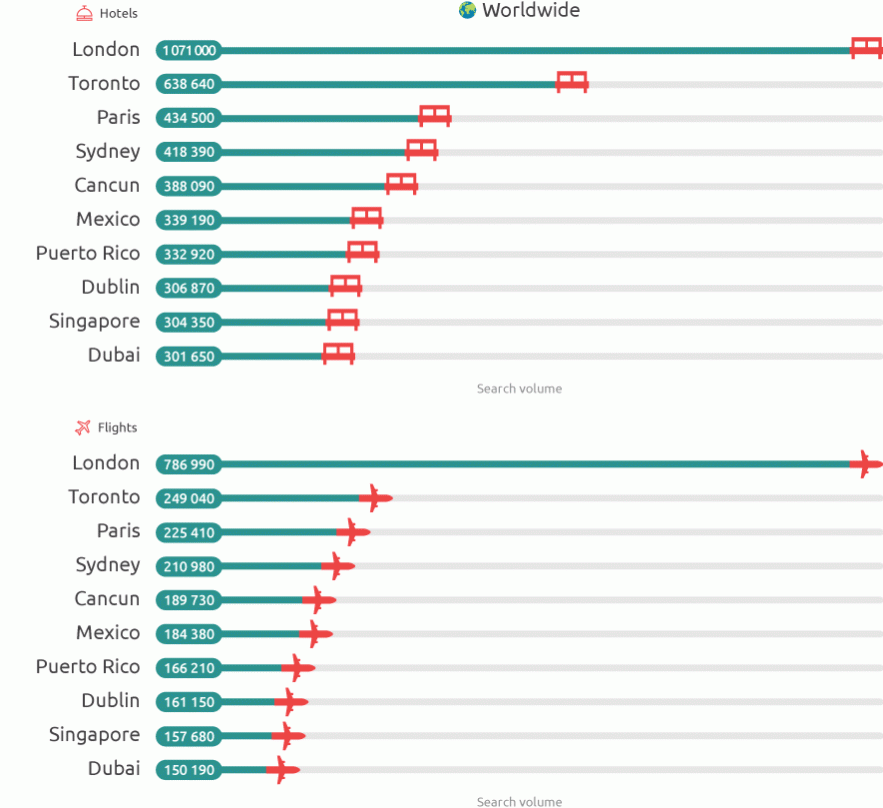
Hands down, London is the center of International travel. The search volume for hotels in the city is nearly double that for those in Paris, while queries for flights to London far exceed searches for the other top destinations.
Top Destinations Advertised by Travel Websites
So what destinations do travel sites promote? Turns out there are some seasonal variations, but there is also some consistency year round for highly popular U.S. and international vacation spots.
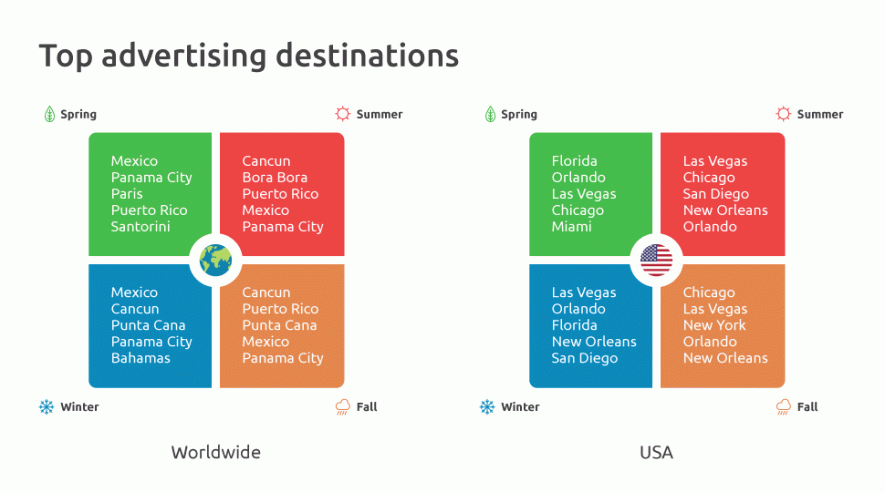
Mexico is heavily favored as a worldwide destination advertised by travel sites, especially its trendy tourist city of Cancun. For U.S. destinations, Las Vegas and Florida are promoted throughout the year.
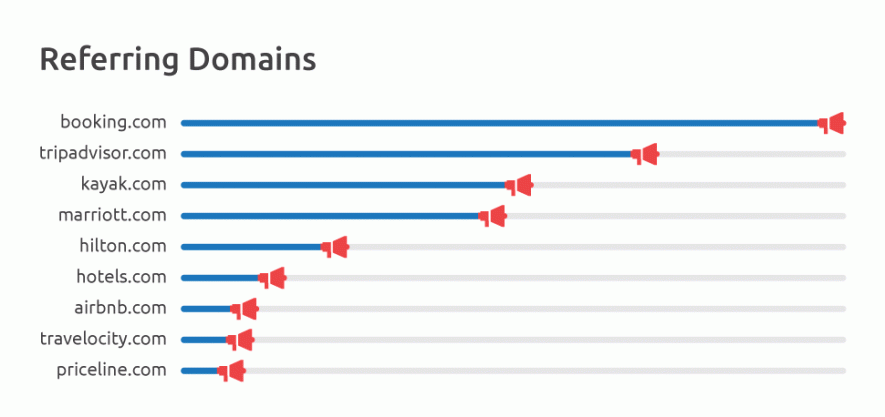
Referral Traffic: A Look at Travel Website Backlink Profiles
A distant third but significant source of travel website traffic, referrals from other site domains drive 9.19% of total traffic. Each of the top 10 site’s referral traffic was derived from analyzing their respective backlink profiles, as shown:
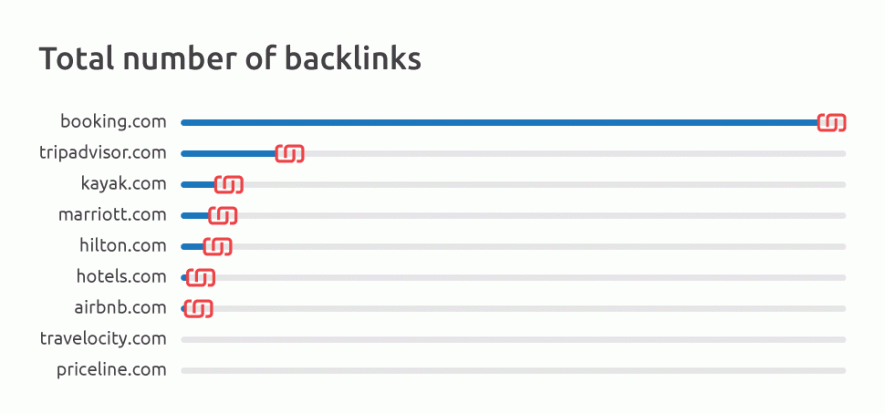
We found that Booking.com has five times more backlinks than TripAdvisor.com.Booking.com is also a champion in its use of Google ads, which account for a respectable 40% of the travel site’s traffic.
When it comes to high-quality backlinks, TripAdvisor is the undisputed leader. We found most of its referral traffic originates from travel-related websites with high trust scores, such as holidaylettings.com and housetrip.it.
Paid Traffic: How Travel Websites Invest in Paid Search
Not far behind referral traffic, paid traffic accounts for 5.39% of travel website visits.
Our analysis further broke down the data for display ads to determine the size and type used by the industry, as well as the devices targeted.
Similar to the findings from our recent Display Advertising report, leaderboard ads (728 x 90) are favored by travel sites, accounting for 25.3% of all display ads. Also, like the Google Display Network (GDN) advertisers we studied, travel sites favor ad dimensions of 160 x 600 (14.3%).
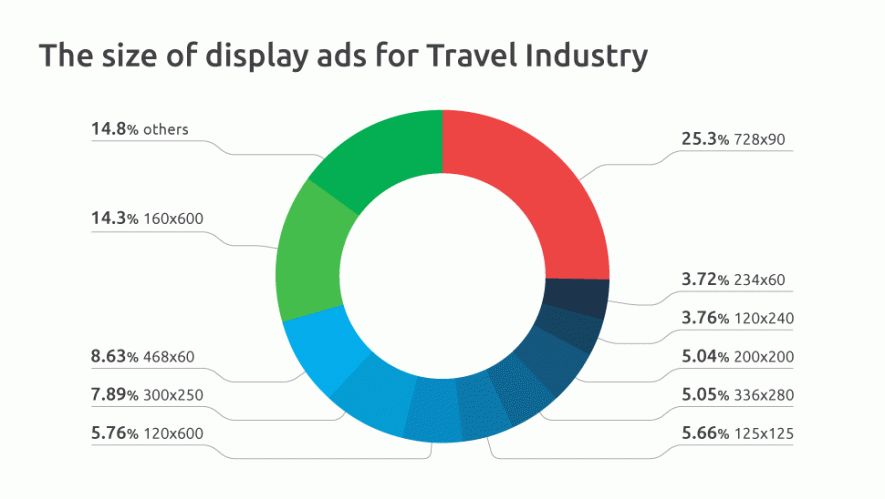
When it comes to the top performing ad sizes identified by Google, the travel industry invests only 7.89% in 300 x 250 ads, and even less (5.05%) in 336 x 280 ads
So, which devices do the travel sites target for paid search? We found tablets the preferred device (Apple and Android tablets are targeted for nearly half of all industry ads, with a combined 49.5%). Mobile devices are the industry’s second choice, claiming a combined total 40.3% of ads.
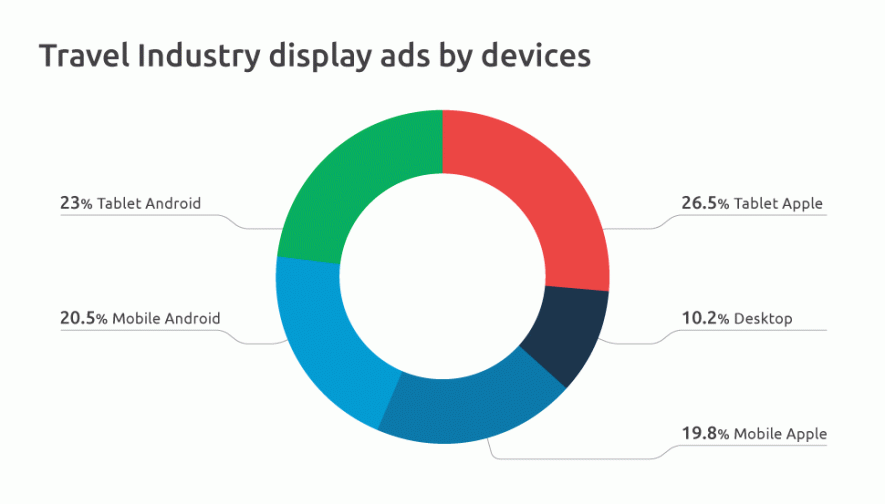
As with our study of major GDN advertisers, we found desktop coming in dead last, being targeted for only 10.2% of travel industry ads.
With the travel industry’s relatively heavy targeting of mobile devices, it’s not surprising that it uses responsive HTML for an impressive 85.9% of its ads, compared to 14.1% for standard media static or animated images.
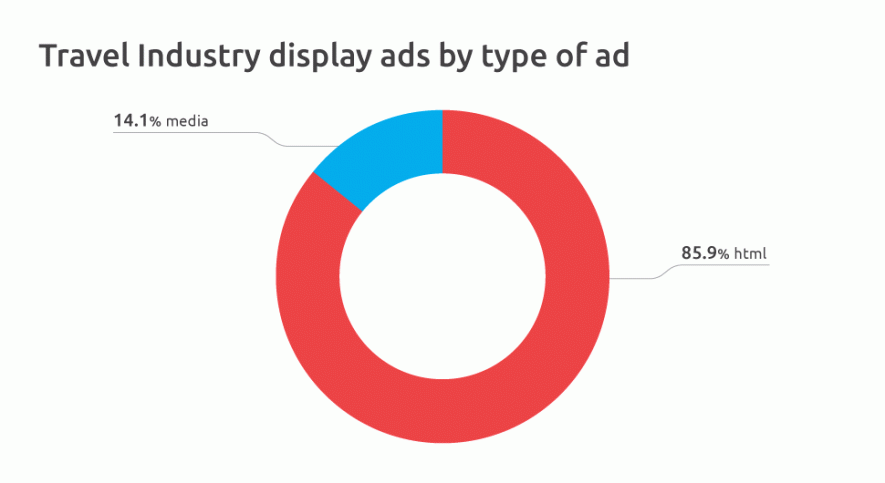
It appears the travel sector has far surpassed other industries with its adoption of HTML. As we reported in our recent article on 2017 display advertising stats, the industries representing major GDN advertisers show an approximate 50/50 split in their use of HTML versus standard ad types — even though they, like the travel industry, heavily favor mobile over desktop.
Social Media: Facebook Utterly Dominates
Lastly, we found that social media channels drive 0.82% of traffic to travel websites. Of that small source (averaged across all of the top 10 domains), Facebook overwhelmingly dominates, driving 82.03% of traffic. The closest second is YouTube, accounting for 6.22% of traffic.
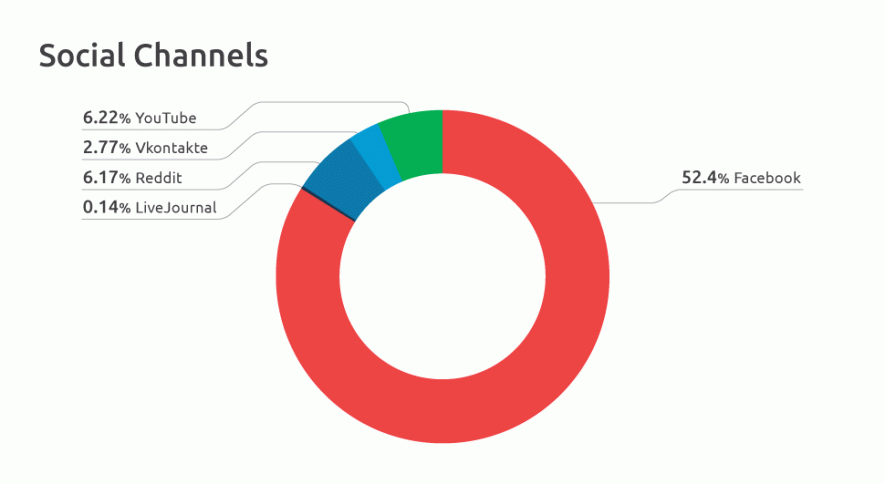
It is interesting to note the international flavor in social media traffic to U.S. travel sites, as the Russian-based Vkontakte accounts for 2.77% of the total.
Conclusions
While it may be assuring to the top 10 travel companies that direct traffic stemming from brand recognition and loyalty are the largest source of their online business, this doesn’t translate into a long-term strategy for growth. As noted in our report on leading e-commerce web traffic, direct traffic is difficult to scale.
Ongoing investment in solid SEO practices, organic search, and referral traffic generated with smart, ethical optimization and quality backlink profile development are well worth the investment to keep your brand front and center in search. It also helps considerably with improving your site’s ranking in the search results pages.
Finally, while paid search is less significant overall as a source of traffic, it augments direct traffic with raising brand awareness and attracting unique (new) site visitors. It also serves to complement organic search efforts for an integrated, balanced approach to growing your travel business.
SEO  Jana Garanko Jana is Head of PR in SEMrush. Together with her team, she increased the brand awareness of SEMrush brand with curious facts and statistics in media. Crazy about data, even if she sleeps.Read the original article here